Blast from the past: the Alitheia database schema
November 14, 2026 · Software Engineering
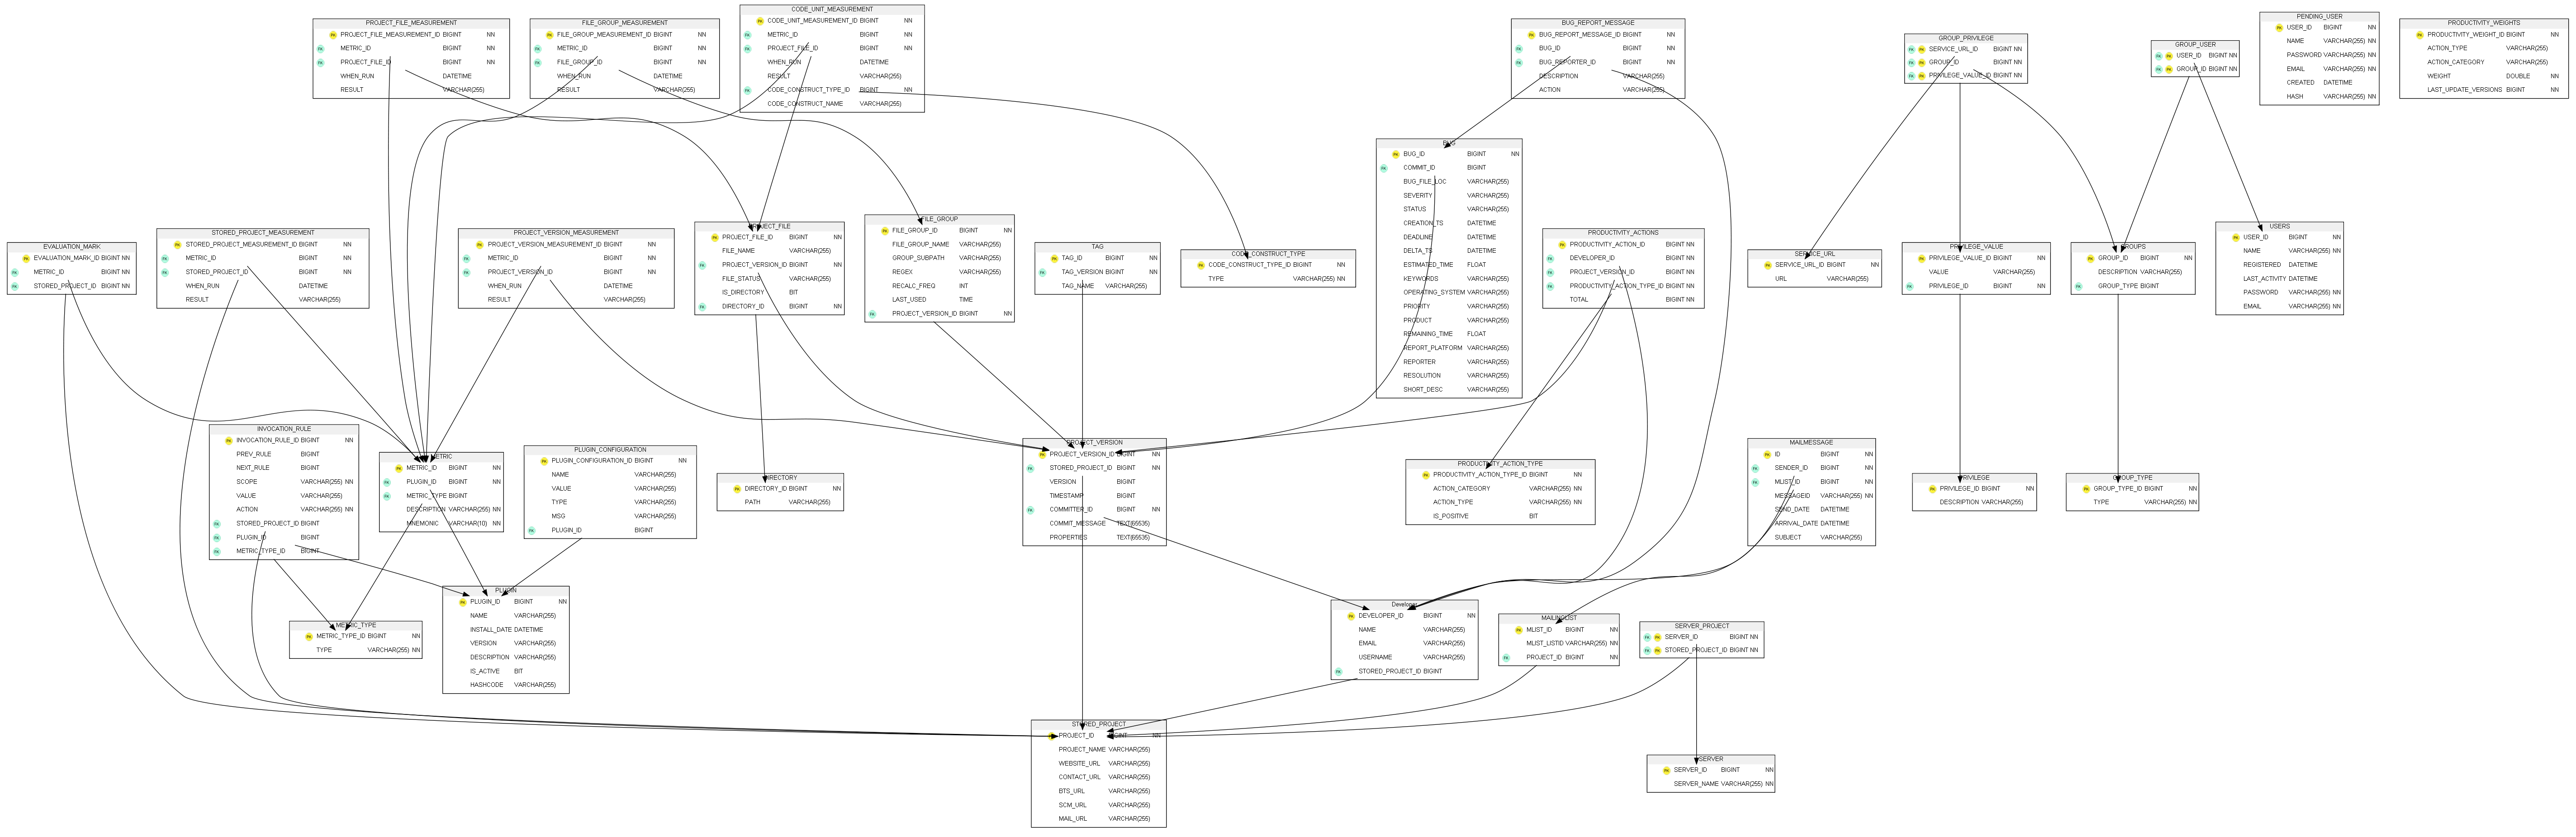
Recently, going through the oldest corners of this blog, I stopped at the shortest SQO-OSS post of all; 23 July 2008, 39 words and a picture. The beta of the platform had just gone up, and I thought it would be "rather useful (at least to a potential contributor :))" to publish the underlying database schema. My friend George (Georgios Gousios) had drawn it with one of his own tools.
The picture is 5,695 by 1,851 pixels. I opened it at full size for the first time in years, counted 37 tables, and started taking notes. This post is those notes; what the schema was, where I think it went wrong, and what I would use if I had to store the same things today.
What it was
SQO-OSS (Software Quality Observatory for Open Source Software) was a European research project that ran from 2006 to 2008, coordinated by our group at AUEB (Athens University of Economics and Business). The idea, as we wrote it in the 2009 ENTCS paper, was simple; open source projects publish their code, their version control history, their mailing lists and their bug databases, so their quality can be measured from the outside, continuously, and compared.
Alitheia (αλήθεια, Greek for "truth") was the platform that did it. An updater mirrored the projects and noticed new commits, mail and bugs. A core on OSGi (the Open Services Gateway initiative framework) extracted metadata from the raw data and stored it in a database. Then metric plugins were asked to calculate their results for each change, and they stored those results in the same database. The paper mentions, as the thing the platform had to protect itself from, a request for "a complete checkout of the source code of KDE for all 830,000 revisions of that project". That was the scale we had in mind.
The same paper also contains a sentence that I read differently today: "We assume that metadata is both smaller and used more briefly than raw project data." Keep it in mind; the schema is where that assumption lives.
Thirty-seven tables
The 37 tables split into seven groups, and the sizes of the groups already say something:
- The project's history, 8 tables: STORED_PROJECT, PROJECT_VERSION, PROJECT_FILE, DIRECTORY, FILE_GROUP, TAG, DEVELOPER and CODE_CONSTRUCT_TYPE.
- The other data sources, 4 tables: BUG and BUG_REPORT_MESSAGE, MAILINGLIST and MAILMESSAGE.
- Plugins and metrics, 5 tables: PLUGIN, PLUGIN_CONFIGURATION, METRIC, METRIC_TYPE and INVOCATION_RULE.
- The results, 6 tables: five *_MEASUREMENT tables and EVALUATION_MARK.
- Developer productivity, 3 tables: PRODUCTIVITY_ACTIONS, PRODUCTIVITY_ACTION_TYPE and PRODUCTIVITY_WEIGHTS.
- The cluster, 2 tables: SERVER and SERVER_PROJECT.
- The web site's users, 9 tables: USERS, PENDING_USER, GROUPS, GROUP_USER, GROUP_TYPE, GROUP_PRIVILEGE, PRIVILEGE, PRIVILEGE_VALUE and SERVICE_URL.
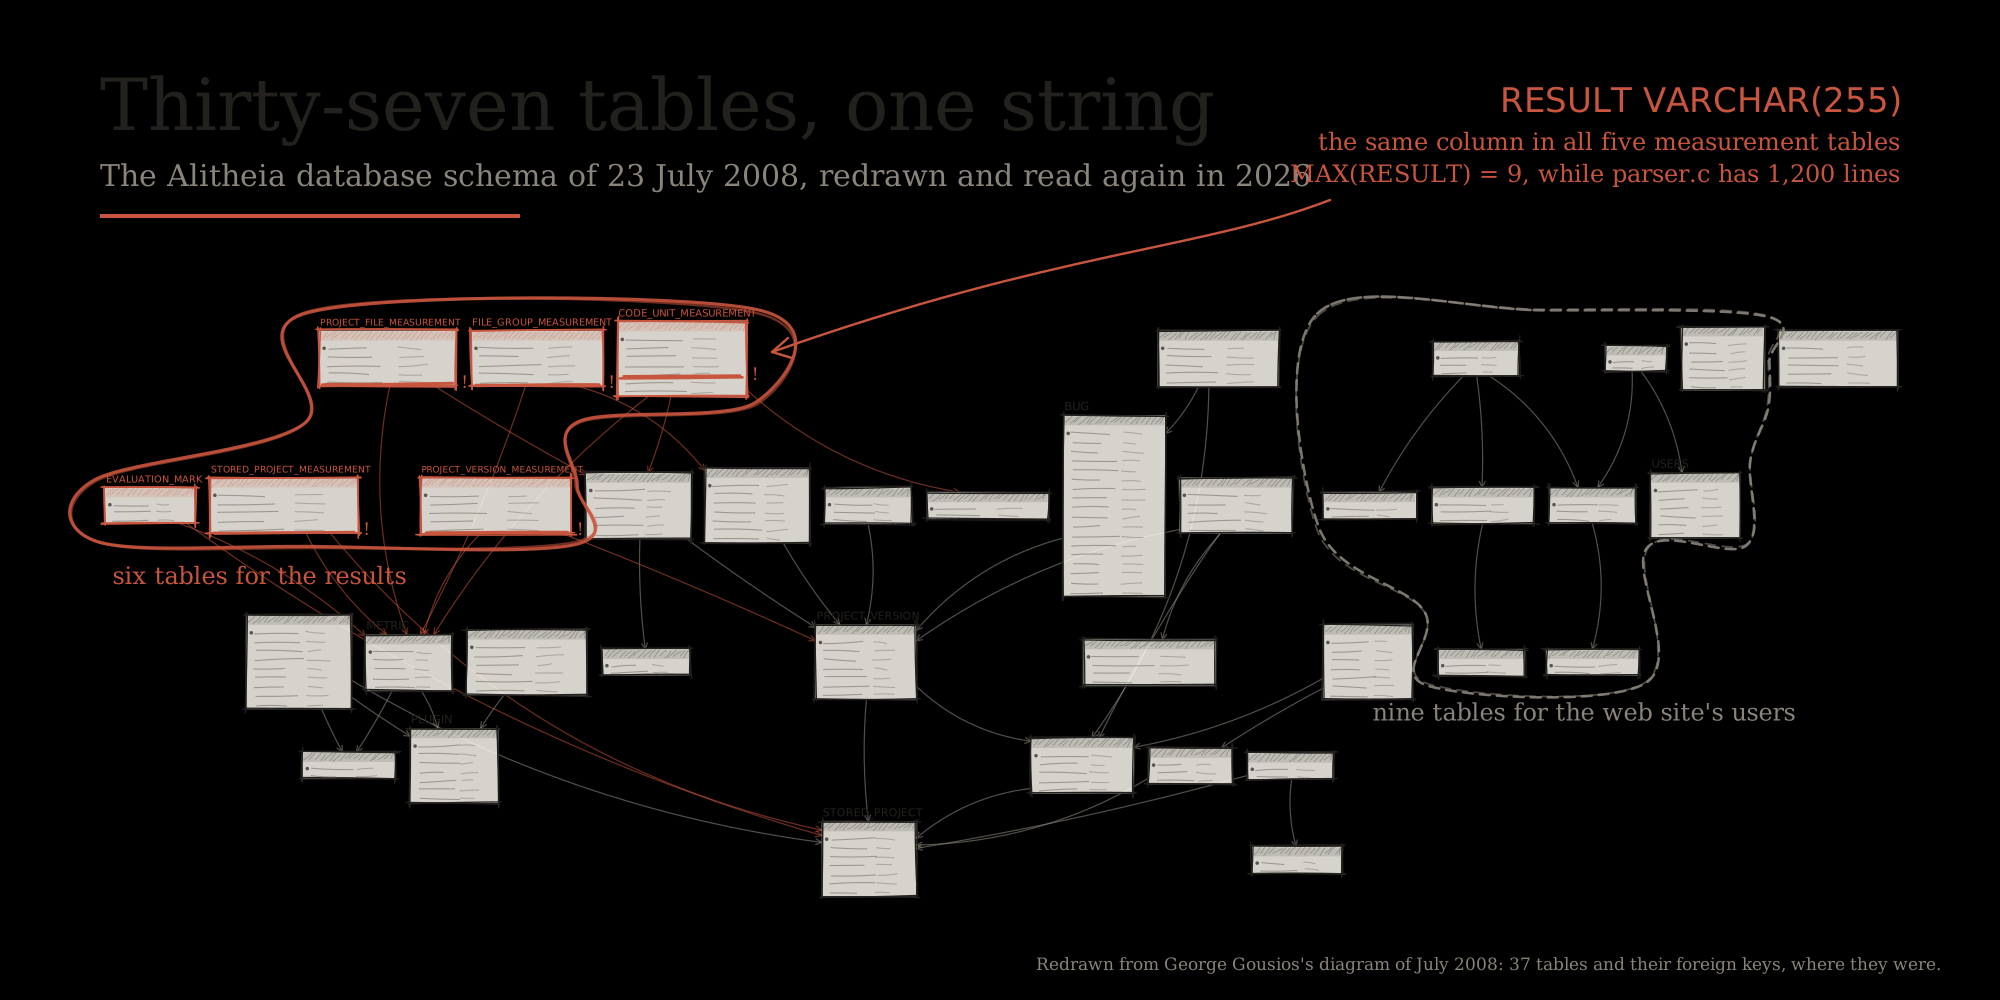
So the reason the platform existed, the measurements, takes 6 tables, and access control for the web front-end takes 9. In 2008 that was normal; one database, one ORM (Object-Relational Mapping) layer (Hibernate, if I remember correctly), everything in it. But it means that a quarter of the schema a "potential contributor" had to understand had nothing to do with software quality.
Where the results go
The interesting part is the six result tables, and I see four problems with them.
The first is the type of the result. Every measurement table ends with the same column; RESULT VARCHAR(255). A line count, a maintainability index, a ratio, a list; all of them are stored as a string of at most 255 characters. The METRIC table has a description and a ten-character mnemonic, but nowhere does the schema say what kind of value a metric produces.
Why this matters is easy to test, so I tested it. I rebuilt PROJECT_FILE_MEASUREMENT as it is in the diagram, in the SQLite that comes with macOS (3.54.0), put five line counts in it (85, 9, 1200, 310 and 40) and asked the obvious question; which are the three largest files?
FILE_NAME  RESULT
---------  ------
util.c     9
main.c     85
README     40

max_loc  total_loc
-------  ---------
9             1644
The largest file in the project is util.c, with 9 lines. Strings compare character by character, and "9" is bigger than "1200". The SUM is correct (1,644), because SQLite (and MySQL) quietly cast each string to a number; PostgreSQL refuses to sum text at all. But MAX and ORDER BY are wrong, and they are wrong in any database, since this is how strings are compared. So every consumer of a result had to know, outside the schema, that this column holds an integer, and cast it before doing anything with it. And a metric whose answer does not fit in a number (a distribution of method sizes, say) had to invent its own encoding into those 255 characters, which the reader then had to know as well.
If I remember correctly, the earliest designs like this come from clinical systems in the 1970s, where it was called EAV (Entity-Attribute-Value); one table, a pointer to the thing measured, a pointer to the attribute and the value as text. It was always the same trade. The schema never has to change, and the meaning of the data moves into the code that reads it.
The second is that the same fact lives in five tables. PROJECT_FILE_MEASUREMENT, FILE_GROUP_MEASUREMENT, PROJECT_VERSION_MEASUREMENT, STORED_PROJECT_MEASUREMENT and CODE_UNIT_MEASUREMENT have the same four columns (an id, the metric, when it ran and the result) and differ only in what they point at. The granularity of a measurement is encoded as a table name. So a metric at a new level (per function, per mail thread, per developer) means a new table, a new mapping and a new release of the core. In fact, measurements per developer did happen, and they did not go into this scheme at all; they got a small system of their own, the three productivity tables, with their own action types and their own weights.
The third is provenance. A measurement points to a METRIC, which points to a PLUGIN, and the PLUGIN row has a VERSION and a HASHCODE. But, as far as I can read from the diagram, the measurement itself records only WHEN_RUN. Fix a bug in the line counting plugin, run it again, and the old results and the new ones look exactly alike; the only way to tell them apart is the timestamp, and to know when the fix was installed. For a platform whose whole point was to be trusted with numbers ("truth" was in the name), that is a strange gap.
The fourth is the shape of history. PROJECT_VERSION has a VERSION and a TIMESTAMP, both BIGINT. That is a Subversion revision number; history is a line, and each version is the one after the previous. Git was already three years old in 2008, and its commits are 40-character hashes with one or more parents, so a history is a graph with branches and merges. Neither fits in a BIGINT, and there is no parent column. PROJECT_FILE, if I read it correctly, has a row per file per version in which it changed (with a FILE_STATUS), so the question "what did the tree look like at revision N" is a query over the entire history up to N.
And as a smaller note, the BUG table is Bugzilla's own column list (BUG_FILE_LOC, DELTA_TS, SHORT_DESC, REPORT_PLATFORM). One bug tracker's schema became the core's definition of a bug.
Ok, in 2008 it made sense
Before going further, it is fair to say what we had to choose from. MongoDB's first release was in 2009. PostgreSQL got a JSON type in 2012 and JSONB, the one you can index, at the end of 2014. Parquet appeared in 2013 and DuckDB in 2019. In 2008 the choice was a relational database behind an ORM, or something you wrote yourself, and we needed transactions, since several updaters and plugins wrote to the same database in parallel.
And the decision underneath was right. Projects, versions, files and developers really are relational; they have identities and they point at each other, and most questions about them are joins. The mistake was not SQL. The mistake was forcing the results, which have a different shape, into the same mould as the entities they describe.
What I would do today
If I had to store the same things in 2026, I would separate three layers, and each would get the technology that fits it.
The history stays relational, but as a graph. A commit table keyed by its hash, a separate table of parent edges (so merges are just two rows), and files addressed by the hash of their content, the way git itself stores them. A file that did not change in a thousand commits is one blob, not a thousand rows. Software Heritage (2016) archives the whole of public source code this way, as a Merkle DAG (Directed Acyclic Graph), so the idea is very well tested by now.
The results go to one table with a typed document. Something like this, in PostgreSQL:
CREATE TABLE measurement (
  metric          text        NOT NULL,  -- 'loc', 'mi', 'method-size-histogram'
  plugin_version  text        NOT NULL,  -- which code produced it
  target_kind     text        NOT NULL,  -- 'blob', 'commit', 'project', 'developer', ...
  target          text        NOT NULL,  -- a content hash, a commit hash, an id
  value           jsonb       NOT NULL,  -- checked against the metric's declared JSON Schema
  computed_at     timestamptz NOT NULL DEFAULT now(),
  PRIMARY KEY (metric, plugin_version, target_kind, target)
);
Each of the four problems goes away in the definition itself. The value is a document with real numbers inside it, and a histogram is just a bigger document. A new granularity is a new target_kind, not a new table. The plugin version is part of the key, so a fix produces new rows next to the old ones instead of rows that cannot be told apart. And because the target of a file metric is the content hash, the result is computed once per distinct file content and reused by every commit that contains it. For the 830,000 KDE revisions this is the difference between measuring every file at every revision and measuring every file once, when it changes.
The raw data goes to documents. This is where a document database really earns its place. Mail messages, bug reports from three different trackers, API responses from a forge; they arrive in different shapes, they change shape over time, and you want to keep them exactly as they came. Store them as documents, and extract the few fields you join on (sender, date, the bug's status) into small relational tables. Then a tracker that is not Bugzilla does not need a new core.
The interesting thing is that this is not my idea. George did exactly this a few years after the PNG, with GHTorrent (2012 and 2013, if I remember the dates correctly); the raw responses of the GitHub API went into MongoDB, and a relational extract went into MySQL for querying. The person who drew the 2008 schema drew the split himself, once he had a dataset big enough to need it. What goes around, comes around.
And the analysis does not need to happen in the operational database at all. The measurements are append-only facts with a few dimensions (metric, target, project, time), which is the star schema Ralph Kimball described in 1996. Looking at the diagram again, we actually had a star; we just cut the fact table into five pieces. Today you export the measurement table to Parquet files once a day, and DuckDB on a laptop reads them directly; the questions we needed a cluster for become an afternoon on a single machine.
Who pays for schema-on-read
Of course, none of this is free, and the cost does not disappear; it moves. In 2008 the core team owned every byte layout in the database. If you wrote a plugin and needed to store something new, you asked us for a table, and the answer took a release. That was slow, but every reader of the data knew exactly what was in it.
A JSON column moves the ownership to the plugin author, which is good for speed. But the bill then goes to whoever reads the data. An untyped JSON column is just VARCHAR(255) with braces; the meaning lives in the code again, only now there are more places to hide it. The thing that makes the 2026 version better is not the document database. It is the JSON Schema that each metric has to declare, and the check that rejects a value that does not match it. Somebody has to write that schema, version it and keep it honest. And with what you end up, if nobody does? With results that nobody can query without reading the plugin's source first, which is exactly where we were with the strings.
Epilogue
The platform outlived the project for a while (if I remember correctly, it was developed for a couple more years), and the papers that came out of it (the ENTCS one is still the most cited work I have my name on) cared about the numbers, not about where they were kept. Nobody ever measured the measurement tables. Maybe nobody ever ran the ORDER BY that would have shown the problem, or maybe everybody cast the column and moved on.
In 2008 I wrote that it is useful, at least to a potential contributor, to know the underlying database schema. I still agree. I would only add that the schema is the part of a platform a contributor can least afford to get wrong, because every plugin written against it inherits its mistakes, and eighteen years later the mistakes are still in the picture, at 5,695 pixels wide.