Graph Coloring
A C program that colours an undirected graph by generating every subset of its vertices, keeping the ones that can share a colour, and covering the graph with as few of those as it can.
A course assignment in C, with the dates on its own files running from 31 December 2001 to 23 January 2002. It gives two answers rather than one: a colouring found by a greedy rule, which is the default, and the minimum colouring found by exhaustive search, under -best. The sources have been public since September 2026, and they build and run on a current machine.
The assignment
One of the most interesting assignments was this one. Its goal was to color a graph (external link, opens in a new tab). A coloring of an undirected graph is an assignment of a label to each node. It is required that the labels on the pair of nodes incident to any edge be different. A minimum coloring of a graph is a coloring that uses as few different labels as possible. The program was written in C and compiled for win32 and linux.
Running it
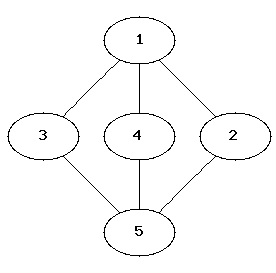
A graph is a count of vertices on the first line and then one edge per line, as a pair of vertex numbers counting from 1. Edges are undirected and duplicates are dropped, so listing an edge in both directions is harmless, which is what the supplied map.5 does:
5
1 2
1 3
1 4
2 5
3 5
4 5
The output is one line per colour, listing the vertices that carry it:
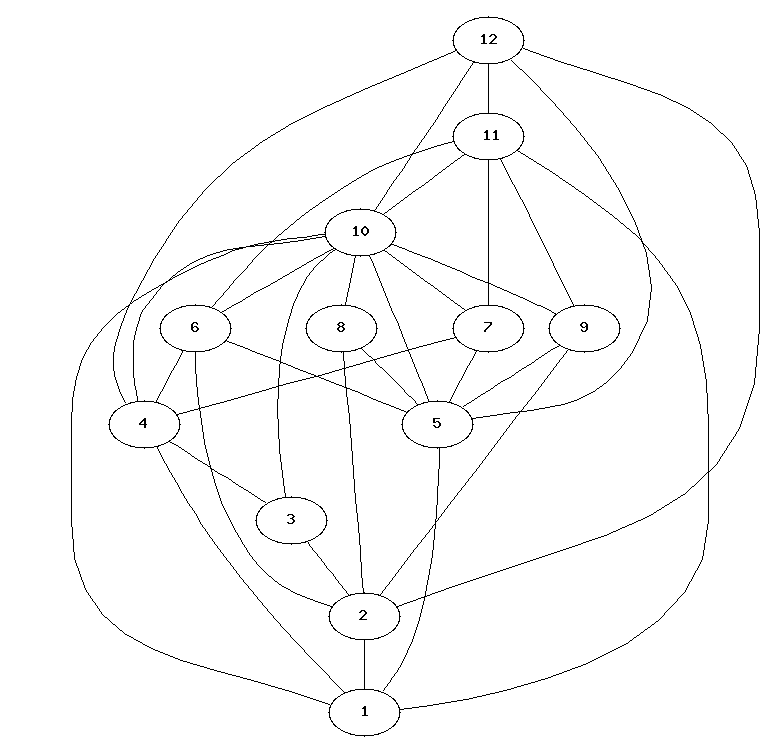
$ ./mapColoring maps/map.12
loading data ... done
Number of nodes: 12
Number of combinations: 4096
Solving problem ... please wait
Greedy selected

Number of colors: 3
Nodes with common color: 1 3 6 7 8 9 12
Nodes with common color: 2 4 5 11
Nodes with common color: 10
-best prints the same thing under a Colors: heading. On this graph it also finds three, split differently: 1 3 6 7 8 9 12, 2 10, 4 5 11. The option is read only when it is the sole argument after the file name, and an unknown spelling is not an error — it quietly runs the greedy search.
The equation behind it
The assignment was handed in with a write-up, in Greek, and it sets the problem out before any of the code does. A graph is a pair of finite sets G = (V, E): V holds the vertices, E the edges, and an edge stands for a relation between the two things its ends represent (the example it opens with is countries, and an edge between two of them means they share a border). Colouring it means giving every vertex a label such that no vertex carries the same label as a neighbour.
The method is the part worth keeping. Rather than reason about colours, the write-up turns the graph into a Boolean equation and solves that. Every vertex becomes a variable, every edge between i and j becomes the clause (xi' OR xj') — at most one end of an edge may be in — and the equation is all of those clauses ANDed together. Take three vertices joined pairwise:
f(x1, x2, x3) = (x1' OR x2') AND (x2' OR x3') AND (x3' OR x1')
That is satisfied at 100, 010 and 001 and nowhere else, so no two of the three can share a colour, which is what you would expect of a triangle. A satisfying assignment is exactly a set of vertices with no edge inside it — an independent set, a group that may all take the same colour — and finding them all means trying all 2n assignments. There is no shortcut in the write-up and there is none in the program; the whole of it is in that sentence.
The supplied map.5 is the worked example. Its equation is
f(x1, x2, x3, x4, x5) = (x1' OR x2') AND (x1' OR x3') AND (x1' OR x4')
                    AND (x4' OR x5') AND (x5' OR x2') AND (x5' OR x3')
and it has ten solutions: 10000, 10001, 01000, 01010, 01110, 01100, 00100, 00110, 00010, 00001. Those ten are the table's independent-set count for that row. The all-zero assignment satisfies the equation too and is thrown away, since colouring nothing is not a colour.
With the ten in hand, the question becomes which of them to pick, and the write-up gives two answers. The exhaustive one takes each solution in turn and extends it with any later solution that shares no vertex with what it already holds, stopping the moment the vertices are all covered and keeping the shortest cover it ever reached. The greedy one repeatedly takes the largest solution that shares no vertex with what it has, and stops when the graph is covered.
Algorithm GraphColoring
INPUT:  S, the solutions of the equation; N, how many there are
OUTPUT: L, the colouring with the fewest colours

for I = 1 to N - 1
    recursive_solution(I, new_list(I), 1)

routine recursive_solution(C, L_rs, L_c)
    if is_solution(L_rs) then
        if L_n > L_c then L = L_rs
        return
    for k = C + 1 to N
        if has_no_common(L_rs, S(k)) then
            recursive_solution(k, append_list(L_rs, L_c, k), L_c + 1)

Algorithm GraphColoring_Greedy
OUTPUT: L, a colouring

L = new_list(null)
while not is_solution(L)
    K = find_max(L, S)
    L = append_list(L, K)
is_solution asks whether the sets chosen so far cover every vertex, has_no_common whether a candidate overlaps them, and find_max hands back the largest one that does not. Those names are still in the C, twenty-four years later: recursive_solve, is_solution, append_list, find_max_solution. The pseudocode was written first and the program was typed from it, which is unusual enough in a student assignment to be worth saying.
How it works
Three stages, and the first one decides everything about what the program can and cannot do.
- Every subset of the vertices is generated and tested. The walk flips one vertex in or out at a time, which is the equation being evaluated one assignment at a time —
calculate_functionincalc.cis that conjunction of clauses, written out as a loop over the edge list. The Number of combinations line reports 2n; the walk itself visits every non-empty subset, 2n−1 of them, and copies each independent set it finds into a linked list. - The greedy search covers the graph with those sets. Take the largest independent set, then repeatedly take the largest one that touches no vertex already coloured, until every vertex has a colour. The number of sets used is the number of colours.
-bestsearches the covers exhaustively, keeping the smallest set of independent sets that covers the graph. Its answer is the chromatic number, not an estimate.
Where the greedy rule loses
Greedy and exhaustive agree on all four supplied graphs, and they do not agree in general. The reason is a specific one rather than the usual story about greedy algorithms being unlucky: once a vertex has a colour, a candidate set containing that vertex is rejected whole. The program never uses part of an independent set, so a set that would colour three of the vertices still waiting is thrown away because it also holds one that is already done.
A nine-vertex graph found by search shows the cost. Greedy reports six colours — 1 7, 2 9, 3 6, and then 4, 5 and 8 on their own. -best reports five: 1 4, 2 9, 3, 5 6, 7 8. Five is that graph's chromatic number, so the greedy rule is one colour over, not the exhaustive search one under.
The four graphs
Four inputs were handed in with the assignment, and two of them repay a second look.
| File | Vertices | Edges | Planar | Colours needed | Independent sets |
|---|---|---|---|---|---|
map.5 | 5 | 6 | yes | 2 | 10 |
map.7 | 7 | 8 | yes | 2 | 27 |
map.12 | 12 | 32 | no | 3 | 154 |
map.109 | 109 | 321 | yes | 4 | — |
map.12 is not planar, so despite the assignment's name it is not the colouring of any map. And map.109 has exactly 3 × 10⁹ − 6 = 321 edges, which is the most a planar graph on 109 vertices can have: it is a triangulation, and it needs all four colours. It is the one input here that makes the four-colour theorem tight, and it is also the one the program can never finish.
Where it stops
./mapColoring maps/map.109 prints its vertex count, then Number of combinations: 649037107316853453566312041152512, and then runs until something stops it. The first stage is 2n with no way out of it.
Measured on an Apple M4 Max, over cycle graphs so that size is the only thing changing: 0.07 s at 24 vertices, 1.34 s at 28, 18.91 s at 32, four times the work for every two vertices added. Carrying that on, 109 vertices is 277 times the 32-vertex run, or somewhere around 1017 years. The universe is about 1.4 × 10¹⁰ years old.
Beside the sources there is a one-line file called 20minutes.txt holding the number 89132660 and nothing else. Twenty minutes of the 2002 machine, at a guess, and roughly what it got through. That is 226.4, so twenty-six vertices was about as far as an afternoon's patience went; the machine above does the same 226 in 0.29 s, and twenty minutes of it would reach thirty-eight. Twenty-four years of hardware bought twelve vertices. The assignment was set on graphs it could finish; the 109-vertex one was there to be looked at, not solved.
Source
The code has been public since 16 September 2026 at bkarak/map_coloring (external link, opens in a new tab), with the four graphs, the Dev-C++ project that built it in 2002 and the Perl script that renders a graph through Graphviz. It needs a C compiler and nothing else:
git clone https://github.com/bkarak/map_coloring.git
cd map_coloring
make && make test
./mapColoring maps/map.12 -best
make test puts the three graphs it can finish through both searches and compares what comes out against recordings taken from the sources as submitted. That matters, because the original build was a Dev-C++ project naming a directory on a machine from 2002, and replacing it left a choice between silencing the warnings a real build turns on and clearing them. They were cleared: seven changes, six of them variables and declarations nothing read.
The seventh had teeth. parse_file ignored what fscanf returned, so a file whose first line was a word rather than a number left the vertex count holding whatever was on the stack, and the program vanished into an enumeration that never came back. It exits with an error now. None of the seven changes an answer — the recordings still match byte for byte — and the repository's README lists them.
The write-up is a Word document from January 2002, handed in at the University of Piraeus under Antonios Panagiotopoulos, and it is not in the repository — the equation, both algorithms and the map.5 example above are translated out of it. The 2004 Win32 and Linux binaries are below, as they were published.
The graphs
Downloads
These are the original files, kept as they were published. Most are decades old and are here as a record rather than as working software.